Price Action Awesome IndicatorThis indicator is everything you need to do Price Action Trading.
It provides signals about:
Inside Bars
Pin Bars
Fakey Pin Bars (background color red or green for bearish or bullish fakeys)
"price action" için komut dosyalarını ara

Price ActionFirst, you have to know price action, RTM price action Handbook could help you
this indicator shows you base and momentum candles
base candles could be zones of trade that show you fighting of bulls and bears, and momentum candles could show the power of those zones.
Base candles are white in the chart, and you can place your order at the good zone.
Rally candles and drop candles are momentum candles, and bold rally and bold drop show that it is more powerful than its before candle.
Zigzag compression is one way that shows the compression in trend.
it looks like the Wedges pattern at classic technical that shows pending orders are closed, so the target zone could be powerful to reverse the trend.
Black background of candle means that candle doesn't reach its before candle and so it is poor candle, I named it domination.
It is better to do not trade at poor candles.
At the end, I find Price action the best way to trade, and it makes you free of other indicator, even volume indicator.
This indicator is good for those who use price action strategy to trade and those who want to learn the price action.
It could be so helpful and reliable way to find the zones, and place buy or sell order and the target, specially for scalping.

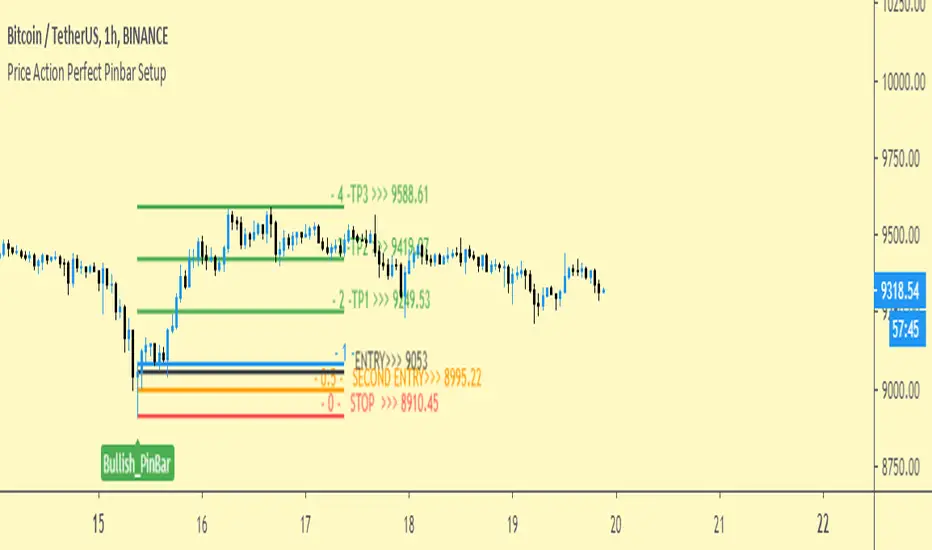
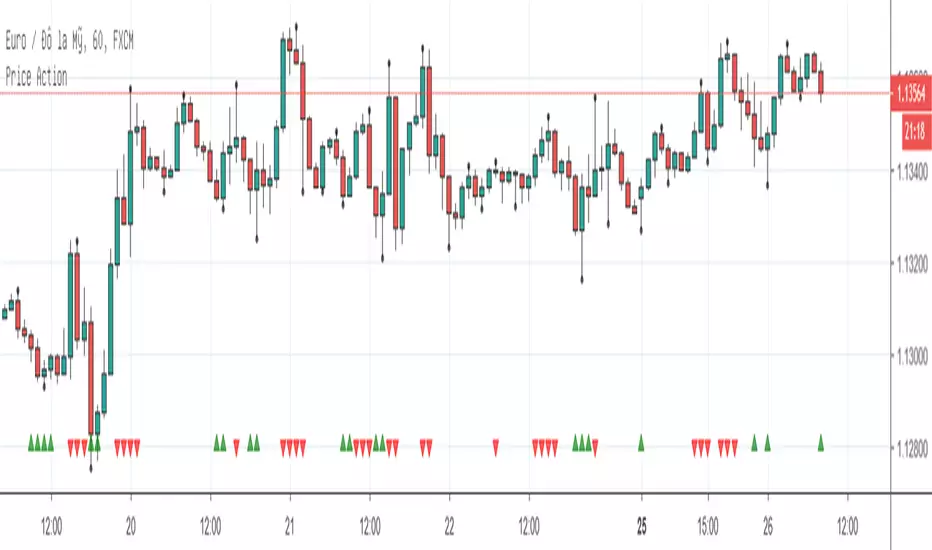
Price Action Perfect Pinbar SetupENGLISH
How works Price Action Perfect Pinbar Setup?
1-it cathes pin bars o charts with algo so ;
* The wick of a pin bar must be more than minumum 3x of body.
* You can change The nose of a pin bar on indicator setting .default value 3 .its meaning body must not be more than 3x of nose
2- After fin bar detected . indicator measure the entire length of the pin bar , from the lowest to its highest point and draw auto fibo .So You can see entries ,stop and targets.
3. Dont trade on every pin bar . You can trade If price on pivots or price on importatan resistance or supports .
TURKISH
Price Action Perfect Pinbar Setup indikatörü nasıl kulanılmalı ?
1.Bu script chart üzerindeki pin bar ları tespit eder şöyle ki;
* Pin barın iğnesi gövedenin minumum 3 katı kadar olmalıdır.
* Gövdenın kuyruğu ise indiköter ayarlarından nose seceneği ile ayarlanabilir. Mevcut değeri 3 tür bu şu anlama gelir kuyruk gövdenin 3 katındanbüyük olamaz.
2. Pin bar tespiti yapıldıktan sonra indicator pin bar uzunluğundan (low ve hıgh değerlerini tespit ederek) otmatik fibo çeker.Böylece trade için giriş yerleri, stop ve hedefler otmatik belirlenir.
3.Her pin bar için trade yapmayınız. Tespit edilen pin bar pivot noktalarında ,önemli arz ve talep bölgelerinde ise trade edebilirsiniz.
DEMO of STC Price ActionThis is replica of the STC Price Action Script & is created for demo purpose only. Few features of original script may not be available in Demo Script.
How this works:
This Indicator looks to identify patterns which shows high movement area which may have occurred due to big orders at that time. It helps to Identify Price Action Zones where we may anticipate some reverse move. These Zones & Moves are helpful for Traders.
Buying Zone is below current Market Price. It indicates Price Action area where Buyers overpowered Sellers hence there was big Leg out Candle. This zone may again give buying momentum if Price comes back to that level. As a Trader one may take opportunity enter into the Trade on Bullish Side.
Selling Zone is above current Market Price. It indicate Price Action area where Sellers overpowered Buyers hence there was big Leg out Candle. This zone may again give Selling momentum if Price comes back to that level. As a Trader one may take opportunity enter into the Trade on Bearish Side.
DISCLAIMER:
This indicator/code IS NOT intended to be a formal investment advice or recommendation by the author, nor should be construed as such. Users will be fully responsible by their use regarding their own trading vehicles/assets.
It is strongly recommended that you should get full knowledge of how price actions work and wait for the clear indications before attempting.

STC Price Action ZoneHow this works:
This Indicator looks to identify patterns which shows high movement area which may have occurred due to big orders at that time. It helps to Identify Price Action Zones where we may anticipate some reverse move. These Zones & Moves are helpful for Traders.
Buying Zone is below current Market Price. It indicates Price Action area where Buyers overpowered Sellers hence there was big Leg out Candle. This zone may again give buying momentum if Price comes back to that level. As a Trader one may take opportunity enter into the Trade on Bullish Side.
Selling Zone is above current Market Price. It indicate Price Action area where Sellers overpowered Buyers hence there was big Leg out Candle. This zone may again give Selling momentum if Price comes back to that level. As a Trader one may take opportunity enter into the Trade on Bearish Side.
DISCLAIMER:
This indicator/code IS NOT intended to be a formal investment advice or recommendation by the author, nor should be construed as such. Users will be fully responsible by their use regarding their own trading vehicles/assets.
It is strongly recommended that you should get full knowledge of how price actions work and wait for the clear indications before attempting.

Synthetic Price Action GeneratorNOTICE:
First thing you need to know, it "DOES NOT" reflect the price of the ticker you will load it on. THIS IS NOT AN INDICATOR FOR TRADING! It's a developer tool solely generating random values that look exactly like the fractals we observe every single day. This script's generated candles are as fake as the never ending garbage news cycles we are often force fed and expected to believe by using carefully scripted narratives peddled as hypnotic truth to psychologically and emotionally influence you to the point of control by coercion and subjugation. I wanted to make the script's synthetic nature very clear using that analogy, it's dynamically artificial. Do not accidentally become disillusioned by this scripts values, make trading decisions from it, and lastly don't become victim to predatory media magic ministry parrots with pretty, handsome smiles, compelling you to board their ferris wheel of fear. Now, on to the good stuff...
BACKSTORY:
Occasionally I find myself in situations where I have to build analyzers in Pine to actually build novel quantitative analytic indicators and tools worthy of future use. These analyzers certainly don't exist on this platform, but usually are required to engineer and tweak algorithms of the highest quality with the finest computational caliber. I have numerous other synthesizers to publish besides this one.
For many reasons, I needed a synthetic environment to utilize the analyzers I built in Pine, to even pursue building some exotic indicators and algorithms. Pine doesn't allow sourcing of tuples. Not to mention, I required numerous Pine advancements to make long held dreams into tangible realities. Many Pine upgrades have arrived and MANY, MANY more are in need of implementation for all. Now that I have this, intending to use it in the future often when in need, you can now use it too. I do anticipate some skilled Pine poets will employ this intended handy utility to design and/or improved indicators for trading.
ORIGIN:
This was inspired by the brilliance from the world renowned ALGOmist John F. Ehlers, but it's taken on a completely alien form from its original DNA. Browsing on the internet for something else, I came across an article with a small code snippet, and I remembered an old wish of mine. I have long known that by flipping back and forth on specific tickers and timeframes in my Watchlist is not the most efficient way to evaluate indicators in multiple theatres of price action. I realized, I always wanted to possess and use this sort of tool, so... I put it into Pine form, but now have decided to inject it with Pine Script steroids. The outcome is highly mutable candle formations in a reusable mutagenic package, observable above and masquerading as genuine looking price candles.
OVERVIEW:
I guess you could call it a price action synthesizer, but I entitled it "Synthetic Price Action Generator" for those who may be searching for such a thing. You may find this more useful on the All or 5Y charts initially to witness indication from beginning (barstate.isfirst === barindex==0) to end (last_bar_index), but you may also use keyboard shortcuts + + to view the earliest plottable bars on any timeframe. I often use that keyboard shortcut to qualify an indicator through the entirety of it's runtime.
A lot can go wrong unexpectedly with indicator initialization, and you will never know it if you don't inspect it. Many recursively endowed Infinite Impulse Response (IIR) Filters can initialize with unintended results that minutely ring in slightly erroneous fashion for the entire runtime, beginning to end, causing deviations from "what should of been..." values with false signals. Looking closely at spg(), you will recognize that 3 EMAs are employed to manage and maintain randomness of CLOSE, HIGH, and LOW. In fact, any indicator's barindex==0 initialization can be inspected with the keyboard shortcuts above. If you see anything obviously strange in an authors indicator, please contact the developer if possible and respectfully notify them.
PURPOSE:
The primary intended application of this script, is to offer developers from advanced to even novice skill levels assistance with building next generation indicators. Mostly, it's purpose is for testing and troubleshooting indicators AND evaluating how they perform in a "manageable" randomized environment. Some times indicators flake out on rare but problematic price fluctuations, and this may help you with finding your issues/errata sooner than later. While the candles upon initial loading look pristine, by tweaking it to the minval/maxval parameters limits OR beyond with a few code modifications, you can generate unusual volatility, for instance... huge wicks. Limits of minval= and maxval= of are by default set to a comfort zone of operation. Massive wicks or candle bodies will undoubtedly affect your indication and often render them useless on tickers that exhibit that behavior, like WGMCF intraday currently.
Copy/paste boundaries are provided for relevant insertion into another script. Paste placement should happen at the very top of a script. Note that by overwriting the close, open, high, etc... values, your compiler will give you generous warnings of "variable shadowing" in abundance, but this is an expected part of applying it to your novel script, no worries. plotcandle() can be copied over too and enabled/disabled in Settings->Style. Always remember to fully remove this scripts' code and those assignments properly before actual trading use of your script occurs, AND specifically when publishing. The entirety of this provided code should never, never exist in a published indicator.
OTHER INTENTIONS:
Even though these are 100% synthetic generated price points, you will notice ALL of the fractal pseudo-patterns that commonly exist in the markets, are naturally occurring with this generator too. You can also swiftly immerse yourself in pattern recognition exercises with increased efficiency in real time by clicking any SPAG Setting in focus and then using the up/down arrow keys. I hope I explained potential uses adequately...
On a personal note, the existence of fractal symmetry often makes me wonder, do we truly live in a totality chaotic universe or is it ordered mathematically for some outcomes to a certain extent. I think both. My observations, it's a pre-deterministic reality completely influenced by infinitesimal amounts of sentient free will with unimaginable existing and emerging quantities. Some how an unknown mysterious mechanism governing the totality of universal physics and mathematics counts this 100.0% flawlessly and perpetually. Anyways, you can't change the past that long existed before your birth or even yesterday, but you can choose to dream, create, and forge the future into your desires and hopes. As always, shite always happens when your not looking for it. What you choose to do after stepping in it unintentionally... is totally up to you. :) Maybe this tool and tips provided will aid you in not stepping in an algo cachucha up to your ankles somehow.
SCRIPTING LESSONS PORTRAYED IN THIS SCRIPT:
Pine etiquette and code cleanliness
Overwrite capabilities of built-in Pine variables for testing indicators
Various techniques to organize Settings panel while providing ease of adjustment utility
Use of tooltip= to provide users adequate valuable information. Most people want to trade with indicators, not blindly make adjustments to them without any knowledge of their intended operation/effects
When available time provides itself, I will consider your inquiries, thoughts, and concepts presented below in the comments section, should you have any questions or comments regarding this indicator. When my indicators achieve more prevalent use by TV members , I may implement more ideas when they present themselves as worthy additions. Have a profitable future everyone!

Auto Price Action - Multi Time Frame [Mehrok]Auto Price Action - Volume Price and Spread - Multi Time Frame
Volume Price and Spread script generates important support and resistance levels basis activity happening in price, volume and candle spread. The basic idea has been taken from concepts of VSA which underlies that weakness appears in uptrend and strength in downtrend. Script will try to find candles which have volume higher then average and candle spread.
Underlying logic:
Script generates significant high's as resistance and lows as support basis activity happened on volume , price and candle spread. Multi Time Frame gives ability to find strong support and resistance levels on higher time frames and display on lower time frame chart.
Usage:
As it records and maintain important high and lows happening on candles till the time new levels are generated therefore generated price levels act as significant support or resistance. Higher the activity in volume , price and spread stronger that price level would act as support or resistance in future.
Script work on all time frame where volume information is available. In absence of volume information script would only generate optional levels and that too if activated.

Auto Price Action - Volume Price and Spread [Mehrok]Auto Price Action - Volume Price and Spread script generates important support and resistance levels basis activity happening in price, volume and candle spread. The basic idea has been taken from concepts of VSA which underlies that weakness appears in uptrend and strength in downtrend. Script will try to find candles which have volume higher then average and candle spread.
Underlying logic:
Script generates significant high's as resistance and lows as support basis activity happened on volume, price and candle spread. Once criteria set in script is met it would then mark that candle with resistance or support line which would act as important price action level later in time.
Usage:
As it records and maintain important high and lows happening on candles till the time new levels are generated therefore generated price levels act as significant support or resistance. Higher the activity in volume, price and spread stronger that price level would act as support or resistance in future.
Settings:
AvgLen- It would allow you to set the SMA settings for volume bars. By default set at 20 means that SMA of 20D volume would be considered in script.
Volume Start Threshold - Default 1.3 - You can change this setting basis stock volatility. This would set the starting point in script to trigger support or resistance levels if volume is equal or higher then the multiplier you have chosen.
Bearish Volume Mult 1, 2 and 3: Set the the levels which can be adjusted to generate x1, x2 or x3 resistance levels which would appear on top of candles.
Bullish Volume Mult 1, 2 and 3: Set the levels which can be adjusted to generate x1, x2, or x3 support levels which would appear at bottom of candles.
Use of bearish and bullish volume mult is to let user define the multiplier value against which current volume bar would be checked. Higher the value means rare it would be.
x1 - Starting level of resistance/support. It would be considered as level 1 of support or resistance which can be broken easily. Happen too often.
x2 - Medium level of resistance/support. It would be considered as level 2 of support or resistance which can give tough fight as price would reach this level. If set as more then 50% of stock volatility of instrument then price would react for sure.
x3 - Strongest level of resistance/support. If set 3 or higher it would be rare to be generated and price may not visit level too often.
Bullish Candle Matrix %: Keep it above 50 to let script check how strong bullish candle is. Strength of candle increase as value increase from 50 towards 100. Keep it at 52 to track maximum bullish candles.
Bearish Candle Matrix %: Keep it below 50 to let script check how strong bearish candle is. Strength of candle increase as value increase from 50 towards 0. Keep it at 47to track maximum bearish candles.
Optional Lines
Optional lines usage no volume activity therefore can generate important price levels basis volume and price only.
Script work on all time frame where volume information is available. In absence of volume information script would only generate optional levels and that too if activated.

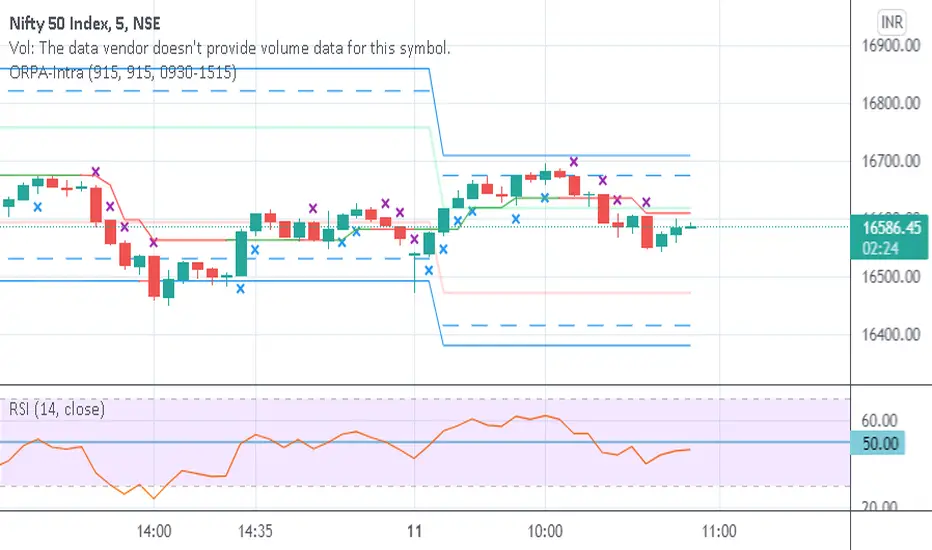
Opening Range-Price Action IntradayThis combines Opening Range of 15 min and Price Action in one script. Crosses are marked on candles for upside and downside. Break of High/Low of cross marked candles gives direction of market.
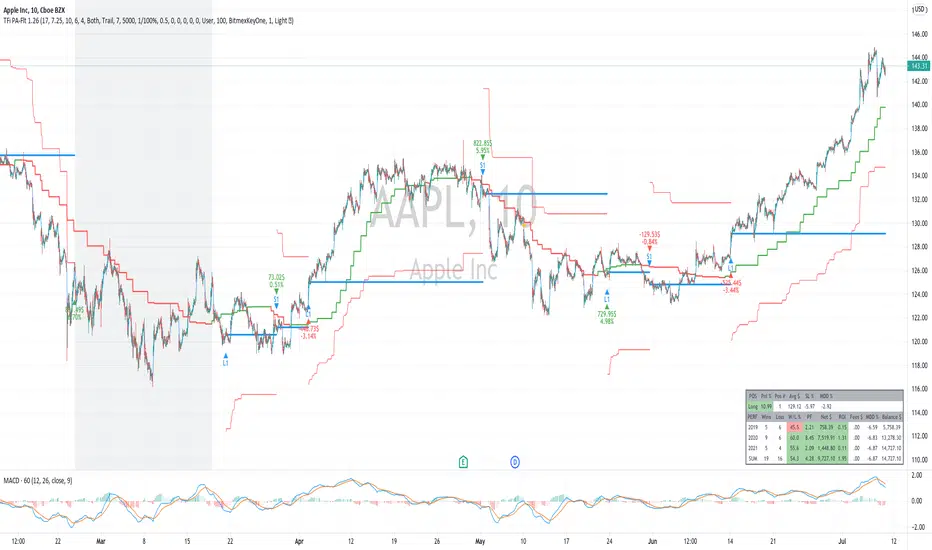
TFi Price Action Resampling Filter V1 - FULLThe script is resampling the price based on its range/price-action and creates an alternative filter to smoothen price movements.
Overview of features:
Optional stop-loss
Optional flags to control the position entry
Optional flags to control the position exit
Built-in backtesting engine with start balance, position size and pyramiding; each year will be evaluated separately
Inputs for a percentage entry and exit slippage, entry/exit and daily funding fees
Configurable alerts, which follow the exact position of the entry/exit marker
Alert messages contain predefined trading instruction to execute orders via Alertatron or TradeFab's proprietary trading server, or can be defined by the user
The script renders a performance/status table, which shows the current position status and result of the built-in trading simulation results.
It shows the following statistic values:
Current position PnL - also background turns green if position is in profit and red if in loss
Average entry price and number of positions
Current percentage distance to the optional stop-loss level
Current Maximum Draw Down
Number of wins and losses and the win/loss ratio per year and overall
Profit and loss amount, paid fees per year and overall
Profit-ratio and Maximum Draw Down per year and overall
Balance and ROI per year and overall
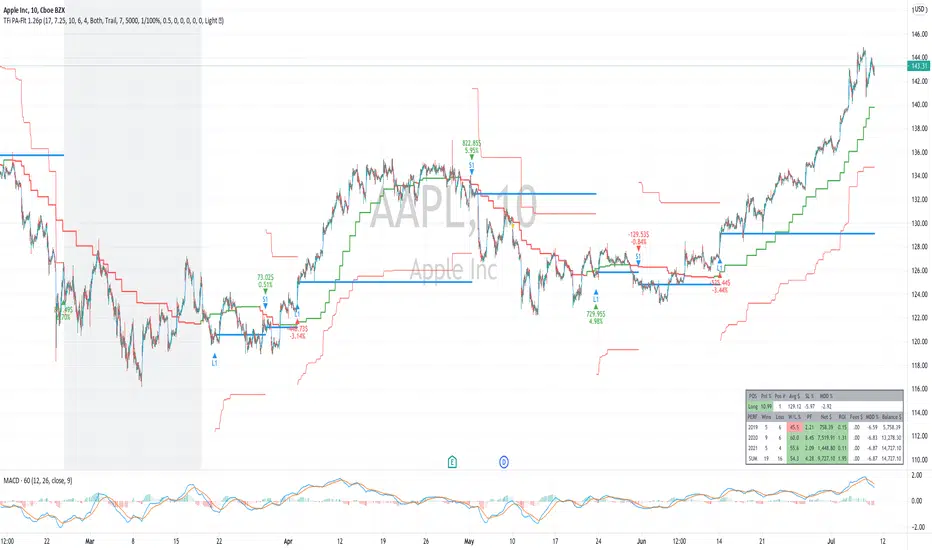
TFi Price Action Resampling Filter V1The script is resampling the price based on its range/price-action and creates an alternative filter to smoothen price movements.
Overview of features:
Optional stop-loss
Optional flags to control the position entry
Optional flags to control the position exit
Built-in backtesting engine with start balance, position size and pyramiding
Inputs for a percentage entry and exit slippage, entry/exit and daily funding fees
Configurable alerts, which follow the exact position of the entry/exit marker
Alert messages contain predefined trading instruction to execute orders via Alertatron or TradeFab's proprietary trading server
The script renders a status box at the last bar, which shows the current position status and result of the built-in trading simulation results.
It shows the following statistic values:
Current position PnL - also background turns green if position is in profit and red if in loss
Average entry price and number of positions
Current percentage distance to the optional stop-loss level
Current Maximum Draw Down
Overall number of wins and losses and the win/loss ratio
Overall profit and loss amount, paid fees
Overall profit-ratio and Maximum Draw Down
Overall balance and ROI
Trend, Stoch, Price Action or in short: TSPCombining the three most important factors that a trader usually needs in a single indicator.
Red = Trend
Blue = Stoch
Orange = Price Action

Price action: Fibonacci + Support/Resistant + TrendlinePrice action: Fibonacci + Support/Resistant + Trendline
In this indicator, I find entry long/Short by combining: Fibonacci + Support/Resistant + Trendline (One of Advanced Price action Analysis).
How it works:
1. Find Impulse wave:
To findind Impulse wave, It uses Pivot High/Low to find Impulse wave. In case find entry Long, If having Pivot High higher Pivot High before, it will draw an Impulse wave.
2. Find entry at Fibonacci levels:
Draw Fibonacci fibonacci retracement from Pivot Low to Pivot High. A Fibonacci retracement forecast is created by taking two extreme points on a chart and dividing the vertical distance by important Fibonacci ratios. 0% is considered to be the start of the retracement, while 100% is a complete reversal to the original price before the move. Horizontal lines are drawn in the chart for these price levels to provide support and resistance levels. Common levels are 23.6%, 38.2%, 50%, and 61.8%
3. Find entry at Support/Resistant Zone:
Support/Resistant Zone drawed from Pivot High before, which price just breaken and return to retest.
4. Find entry at Trendline:
Trendline drawed from Pivot High/Low before, which price just breaken and return to retest.
This is study version. Having strategy version to backtesting.

Price Action Analyst [OmegaTools]Price Action Analyst (PAA) is an advanced trading tool designed to assist traders in identifying key price action structures such as order blocks, market structure shifts, liquidity grabs, and imbalances. With its fully customizable settings, the script offers both novice and experienced traders insights into potential market movements by visually highlighting premium/discount zones, breakout signals, and significant price levels.
This script utilizes complex logic to determine significant price action patterns and provides dynamic tools to spot strong market trends, liquidity pools, and imbalances across different timeframes. It also integrates an internal backtesting function to evaluate win rates based on price interactions with supply and demand zones.
The script combines multiple analysis techniques, including market structure shifts, order block detection, fair value gaps (FVG), and ICT bias detection, to provide a comprehensive and holistic market view.
Key Features:
Order Block Detection: Automatically detects order blocks based on price action and strength analysis, highlighting potential support/resistance zones.
Market Structure Analysis: Tracks internal and external market structure changes with gradient color-coded visuals.
Liquidity Grabs & Breakouts: Detects potential liquidity grab and breakout areas with volume confirmation.
Fair Value Gaps (FVG): Identifies bullish and bearish FVGs based on historical price action and threshold calculations.
ICT Bias: Integrates ICT bias analysis, dynamically adjusting based on higher-timeframe analysis.
Supply and Demand Zones: Highlights supply and demand zones using customizable colors and thresholds, adjusting dynamically based on market conditions.
Trend Lines: Automatically draws trend lines based on significant price pivots, extending them dynamically over time.
Backtesting: Internal backtesting engine to calculate the win rate of signals generated within supply and demand zones.
Percentile-Based Pricing: Plots key percentile price levels to visualize premium, fair, and discount pricing zones.
High Customizability: Offers extensive user input options for adjusting zone detection, color schemes, and structure analysis.
User Guide:
Order Blocks: Order blocks are significant support or resistance zones where strong buyers or sellers previously entered the market. These zones are detected based on pivot points and engulfing price action. The strength of each block is determined by momentum, volume, and liquidity confirmations.
Demand Zones: Displayed in shades of blue based on their strength. The darker the color, the stronger the zone.
Supply Zones: Displayed in shades of red based on their strength. These zones highlight potential resistance areas.
The zones will dynamically extend as long as they remain valid. Users can set a maximum number of order blocks to be displayed.
Market Structure: Market structure is classified into internal and external shifts. A bullish or bearish market structure break (MSB) occurs when the price moves past a previous high or low. This script tracks these breaks and plots them using a gradient color scheme:
Internal Structure: Short-term market structure, highlighting smaller movements.
External Structure: Long-term market shifts, typically more significant.
Users can choose how they want the structure to be visualized through the "Market Structure" setting, choosing from different visual methods.
Liquidity Grabs: The script identifies liquidity grabs (false breakouts designed to trap traders) by monitoring price action around highs and lows of previous bars. These are represented by diamond shapes:
Liquidity Buy: Displayed below bars when a liquidity grab occurs near a low.
Liquidity Sell: Displayed above bars when a liquidity grab occurs near a high.
Breakouts: Breakouts are detected based on strong price momentum beyond key levels:
Breakout Buy: Triggered when the price closes above the highest point of the past 20 bars with confirmation from volume and range expansion.
Breakout Sell: Triggered when the price closes below the lowest point of the past 20 bars, again with volume and range confirmation.
Fair Value Gaps (FVG): Fair value gaps (FVGs) are periods where the price moves too quickly, leaving an unbalanced market condition. The script identifies these gaps:
Bullish FVG: When there is a gap between the low of two previous bars and the high of a recent bar.
Bearish FVG: When a gap occurs between the high of two previous bars and the low of the recent bar.
FVGs are color-coded and can be filtered by their size to focus on more significant gaps.
ICT Bias: The script integrates the ICT methodology by offering an auto-calculated higher-timeframe bias:
Long Bias: Suggests the market is in an uptrend based on higher timeframe analysis.
Short Bias: Indicates a downtrend.
Neutral Bias: Suggests no clear directional bias.
Trend Lines: Automatic trend lines are drawn based on significant pivot highs and lows. These lines will dynamically adjust based on price movement. Users can control the number of trend lines displayed and extend them over time to track developing trends.
Percentile Pricing: The script also plots the 25th percentile (discount zone), 75th percentile (premium zone), and a fair value price. This helps identify whether the current price is overbought (premium) or oversold (discount).
Customization:
Zone Strength Filter: Users can set a minimum strength threshold for order blocks to be displayed.
Color Customization: Users can choose colors for demand and supply zones, market structure, breakouts, and FVGs.
Dynamic Zone Management: The script allows zones to be deleted after a certain number of bars or dynamically adjusts zones based on recent price action.
Max Zone Count: Limits the number of supply and demand zones shown on the chart to maintain clarity.
Backtesting & Win Rate: The script includes a backtesting engine to calculate the percentage of respect on the interaction between price and demand/supply zones. Results are displayed in a table at the bottom of the chart, showing the percentage rating for both long and short zones. Please note that this is not a win rate of a simulated strategy, it simply is a measure to understand if the current assets tends to respect more supply or demand zones.
How to Use:
Load the script onto your chart. The default settings are optimized for identifying key price action zones and structure on intraday charts of liquid assets.
Customize the settings according to your strategy. For example, adjust the "Max Orderblocks" and "Strength Filter" to focus on more significant price action areas.
Monitor the liquidity grabs, breakouts, and FVGs for potential trade opportunities.
Use the bias and market structure analysis to align your trades with the prevailing market trend.
Refer to the backtesting win rates to evaluate the effectiveness of the zones in your trading.
Terms & Conditions:
By using this script, you agree to the following terms:
Educational Purposes Only: This script is provided for informational and educational purposes and does not constitute financial advice. Use at your own risk.
No Warranty: The script is provided "as-is" without any guarantees or warranties regarding its accuracy or completeness. The creator is not responsible for any losses incurred from the use of this tool.
Open-Source License: This script is open-source and may be modified or redistributed in accordance with the TradingView open-source license. Proper credit to the original creator, OmegaTools, must be maintained in any derivative works.

Price Action Volumetric Order Blocks [UAlgo]"Price Action Volumetric Order Blocks" indicator aims to identify significant price zones in the market based on a combination of price action and volume analysis. It utilizes the concept of "Order Blocks," which are areas on the chart where large orders are believed to have been placed, influencing price behavior. By analyzing price swings and volume activity, the indicator attempts to highlight potential support and resistance levels.
🔶 Key Features
Swing Length: This input allows you to adjust the timeframe used to identify price swings for order block detection. A longer swing length will focus on larger timeframes and potentially capture stronger order blocks.
Show Last X Order Blocks: This controls the number of order blocks displayed on the chart. You can choose to visualize a specific number of the most recent order blocks.
Violation Check: This setting determines how the indicator identifies potential order block violations. You can choose between "Wick" or "Close" violations. A "Wick" violation occurs when the price (wick) extends beyond the order block boundaries, while a "Close" violation signifies that the closing price breaches the order block.
Hide Overlap: This option allows you to manage the display of overlapping order blocks. If set to "True," only non-overlapping order blocks will be shown, potentially offering a clearer visualization.
Colors: You can customize the color scheme for bullish (upward) and bearish (downward) order blocks to enhance visual clarity on the chart.
🔶 Interpreting the Indicator
Order Blocks: The teal-colored boxes represent bullish order blocks, indicating areas of demand where buying pressure is likely to be strong. Red-colored boxes represent bearish order blocks, indicating areas of supply where selling pressure is likely to be dominant. These zones often signal potential reversal points or consolidation areas.
Strength Calculations: The indicator calculates the relative strength of bullish and bearish blocks based on volume. A higher bullish strength indicates stronger buying pressure, while higher bearish strength suggests more selling pressure. Traders can use this information to gauge the strength of a price level and predict future price movements.
Market Structure Lines: The indicator displays horizontal lines to depict the current market structure, labeled as "MSB" (Market Sell Balance) or "BOS" (Break of Structure). These lines can help visualize the prevailing trend direction.
Order Block Violations: When a price wick or close breaches an order block (depending on the chosen violation type), the corresponding order block visualization is removed from the chart. This can signify a potential weakening of the identified support or resistance zone.
🔶 Disclaimer
Use with Caution: This indicator is provided for educational and informational purposes only and should not be considered as financial advice. Users should exercise caution and perform their own analysis before making trading decisions based on the indicator's signals.
Not Financial Advice: The information provided by this indicator does not constitute financial advice, and the creator (UAlgo) shall not be held responsible for any trading losses incurred as a result of using this indicator.
Backtesting Recommended: Traders are encouraged to backtest the indicator thoroughly on historical data before using it in live trading to assess its performance and suitability for their trading strategies.
Risk Management: Trading involves inherent risks, and users should implement proper risk management strategies, including but not limited to stop-loss orders and position sizing, to mitigate potential losses.
No Guarantees: The accuracy and reliability of the indicator's signals cannot be guaranteed, as they are based on historical price data and past performance may not be indicative of future results.

Price Action SignalsPrice Action Signals – Buy, Sell, and Exit (80% Accuracy)
This powerful indicator provides clear Buy, Sell, and Exit signals based on proven price action patterns, offering traders a simple yet effective tool for decision-making. With an impressive 80% accuracy rate, it helps identify high-probability trade setups and manage exits for optimal profits.

Price Action Institutional LevelsPrice Action Institutional Levels
This script places the institutionnal support and resistances for a Price Action analysis.
Differents levels are available for different trading style :
- Swing trading (250 pips / 100 pips)
- Intraday trading (100 pips / 20-50-80 pips)
Applicable for forex, cfd, index market.
-User can select
-numbers of visibles levels
-type of visibles levels

Price Action ChannelsPrice action channels are a great advantage as they provide insight to institutional ways of trading. Generally, they are based on a moving average of the price high and price low.
To elaborate, if price breaks above the channel and remains above channel after candle close it is considered a bullish signal. Conversely, if price breaks below channel and remains below channel after candle close, it is considered bearish. If within / inside the channel one stays out of the market and you may realize this is also when price is consolidating or may be ranging.
The application herein is based on 3Dimensional charting for specific time frames that will let you know whether in other time frames price action is above or below those channels. This is an advantage as it may let you stay in your trade or exit depending on your money management. When applying 3D one has a clear indication of where price stands and also allows you to stack on your probabilities in a trade.
This indicator also contains the fast guppy if you decide to apply them to your chart which creates an additional advantage.
Money management is trader's choice.
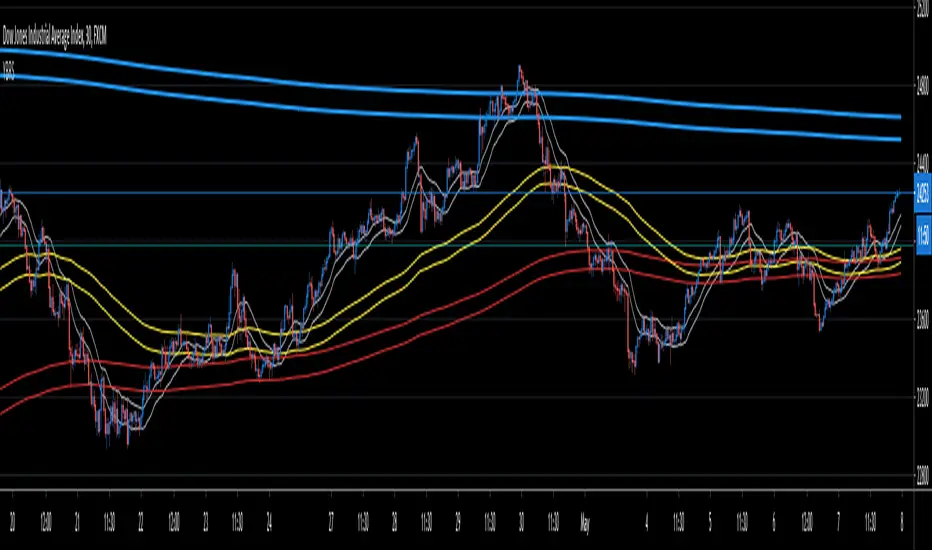


Price ActionPrice action indicator with 6 & 18 ema short term trend, 50 & 65 sma longer term trend as well as scaled hammers, hangman, dogi, dragonfly dogi, gravestone dogi, bull engulfing and bear engulfing signals
